Complete technical solution from biological resource management to imaging
PRODUCTS
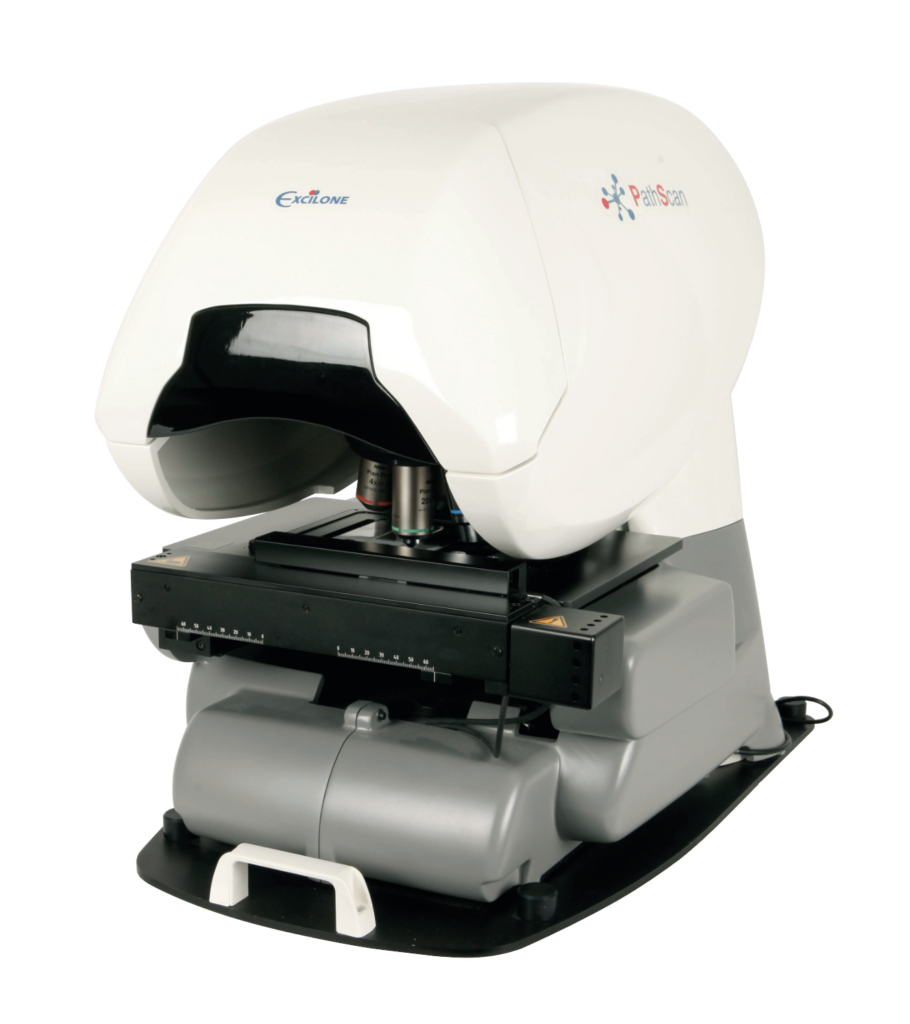
PathScan® Combi is a histological slide scanner that combines transmitted light and fluorescence scanning thanks to a dual-camera system (color and monochrome) :
PathScan® Combi enables brightfield and fluorescence images to be matched for FISH analysis using EVA® software, in the same tumor zone as that previously identified by the pathologist in brightfield.
With its dedicated Web application, PathScan® Combi provides remote access to acquired images and password-protected access to individual files and working environments.
Specifications :
The scanner complies with the In Vitro Diagnostic Regulation (IVDR) (EU) 2017/74.
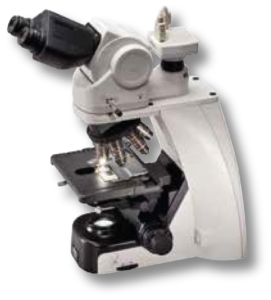 By combining a microscope, a camera and dedicated acquisition software, PathScan® Touch offers all the flexibility of a microscope to manual slide acquisition. Pathscan® Touch generates virtual slides of similar quality to those produced by slide scanners.
This solution makes it possible to obtain virtual slides in real time, when the slide is moved under the microscope, at all the objectives fitted to the microscope.
PathScan® Touch is an intuitive, easy-to-use solution whose software enables the acquisition of whole slides or zones of interest, depending on the tissue and the user’s needs.
The virtual slides generated are saved in TIFF format and can be easily shared and/or used in image analysis or other applications :
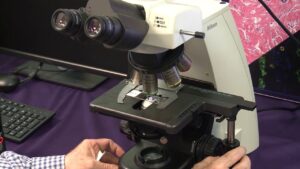
Pathscan® Touch is a “ready-to-use” solution comprising a microscope (such as the Nikon Eclipse Ci-L), a camera and dedicated acquisition software, but can also be installed on an existing microscope (subject to compatibility).
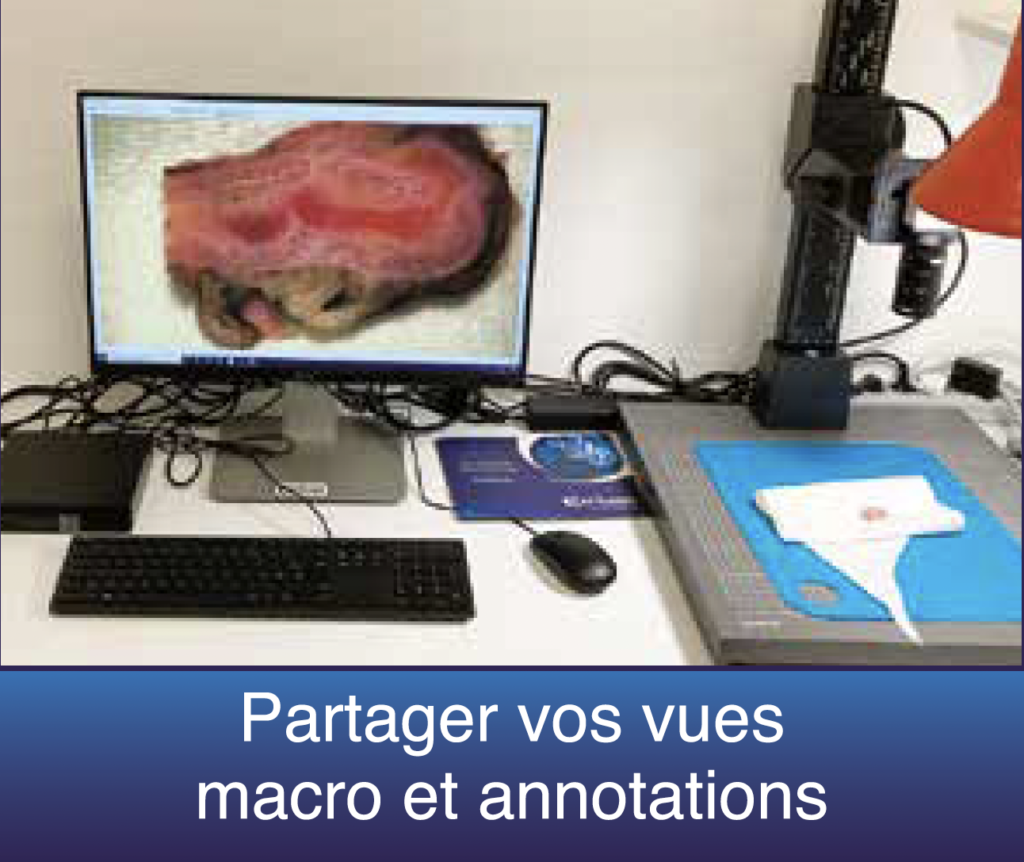
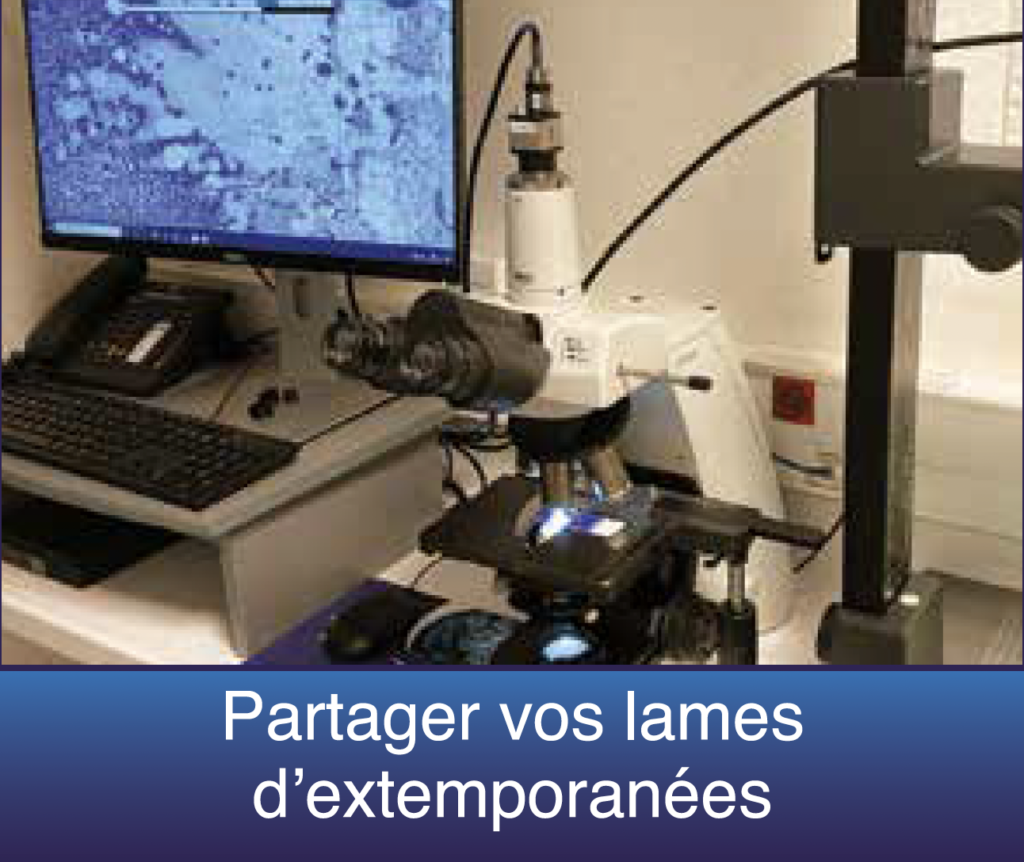
Solutions equipped with cameras and a software interface accessible simultaneously by the technician and the remote pathologist. In particular, this interface enables both actors to make annotations on the live image, such as indicating recuts, taking measurements, etc… These video images and any annotations visible in real time to the pathologist and technician thus enable the pathologist to observe tissue macroscopically without being physically present, but also to assist the technician in recutting operations.
Photographs can also be taken to document patient files.
PathScan® Macro Mono
The extempo solution with its manually adjustable focus and zoom camera, designed for installation on a photo/macro bench.
PathScan® Macro Duo
The dedicated solution for macroscopy, with 2 cameras integrated in a housing designed for use in the atmosphere of macroscopy rooms.
The 2 software-controlled cameras cover a wide field of view, suitable for both small and large applications.
than large surgical specimens.
The box can be installed on a macro bench, but also on a macroscopy table, thanks in particular to its magnetic fixing system.
A installer sur PC, Excilone® View can read a wide range of virtual slide file formats, both brightfield and fluorescence. Fluid navigation lets you open multiple images simultaneously, move around (with or without synchronization), zoom in and out, and adjust magnification with virtual lenses.
Annotation tools (distance measurements, surface measurements, region of interest, exclusion zone) make it easy to create multiple levels of annotation (layers) and export information to third-party image analysis software (such as Halo™ from IndicaLabs, for example).
Currently supported image formats :
Allows you to centralize all your virtual blades in the same environment, regardless of image format.
Excilone® View Web can be installed on physical servers or in the cloud, and an SSL certificate with Https protocol ensures a secure connection and data protection.
The Excilone® View Web license is perpetual with no limit on the number of users.
Excilone® View Web is available in English and French. The platform is accessible from PCs, Macs and tablets, and is browser-compatible.
Excilone® View Web allows you to perform the following operations :
Key words :
Compatible image formats :
The HALO™ platform supports Indica Labs image analysis algorithms. This set of tools includes a wide range of applications for oncology, neuroscience, metabolic diseases, toxicology pathology and much more.
The Halo™ platform can be installed on a single workstation (PC) or as part of a site license for wider use (contact us for installation conditions).
Analysis tools for IHC and CISH/ISH
Specific applications for :
Analysis tools for fluorescence
And also tools for FISH
Spot identification is undoubtedly the most time-consuming and difficult stage in preparing tissue array spots for analysis. Identification includes detecting spots on the slide scan, then associating each of these spots with their respective position in the initial plan of your Arrays tissue, to create the essential traceability link between spot and patient data.
Spot Browser® 4 includes a de-Arraying tool for data detection and association. Simply import your tissue array map file, and Spot Browser® 4 takes care of the rest. Interactions and corrections are always possible in cases where the Tissue Array is truly in poor condition on the blade (severe deformations).
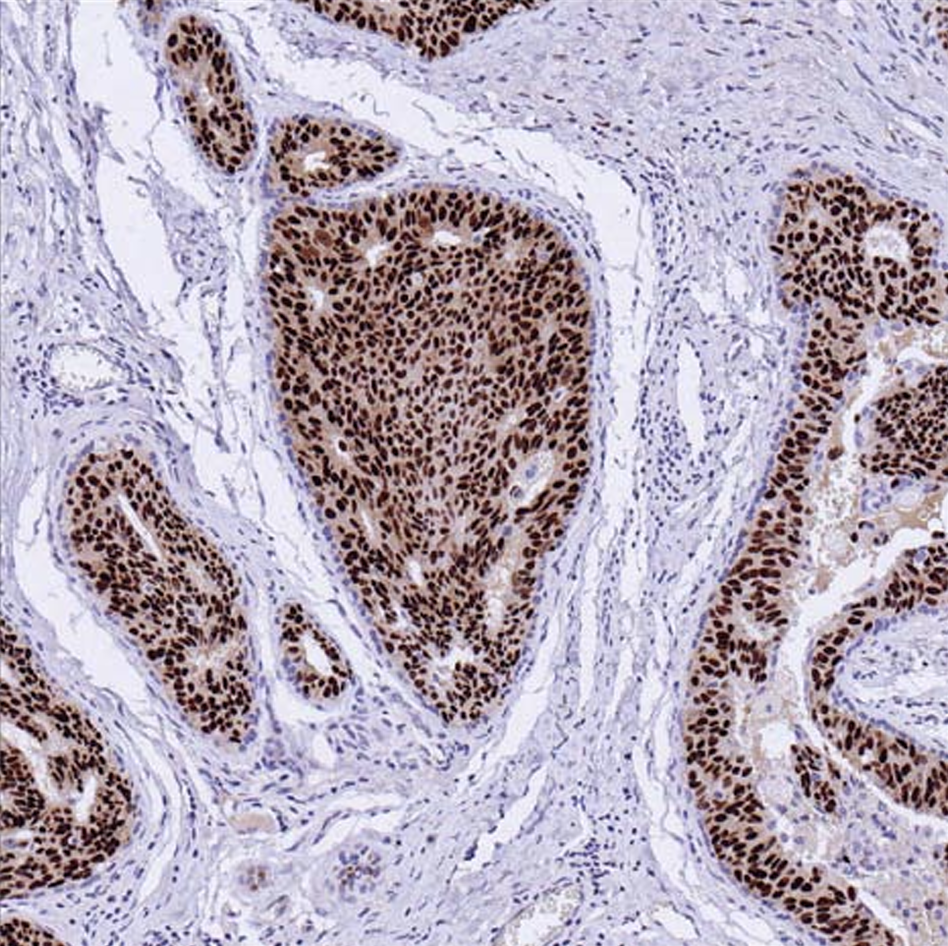
Annotation on tissue array spots
In many cases, spots are “scored” visually, because the pathologist’s expert eye cannot so easily be replaced by software, however powerful.
To meet this need, Spot Browser® 4 allows users to create their own data fields in various formats (free, numeric, drop-down list…) to enter their annotations. The user can quickly navigate from one spot to another and enter annotations.
Input and imported data can be exported in Excel format for statistical processing.
Automatic analysis of tissue array spots
For analysis of large numbers of spots or for quantitative analysis, Spot Browser® 4 offers a comprehensive tool for automatic image analysis.
HSV color and morphometry are the characteristics used. Each of these features can be used alone or in combination, depending on the objects to be detected.
Users can easily create their own detection protocols, with one or more types of object to be detected, and with or without nesting, for example, to count labeled nuclei in a tumor zone. Cytoplasmic and membrane labelling can also be detected.
Detection and analysis protocols can be saved in internal libraries for future use.
The user can analyze spots one by one or in automatic batch mode, and analyses can combine human intervention (zone tracing, for example) with fully automatic modes.
Raw and interpreted results can be exported to Excel.